Data & Reporting
Transform raw data into actionable business intelligence
Make Data-Driven Decisions with Confidence
At TripleGem IT Solutions, we believe that data is only valuable when it leads to action. Our data and reporting services help businesses move beyond spreadsheet chaos to clear, actionable insights that drive better decisions. We design and build custom dashboards, automate reporting workflows, and implement analytics systems that give you real-time visibility into your business performance. Whether you need executive dashboards, operational reports, or deep analytical capabilities, we transform your raw data into the intelligence you need to succeed.
Your business generates data every day, but are you actually using it? We help businesses move beyond spreadsheet chaos to clear, actionable dashboards and reports that drive better decisions. From executive summaries to operational metrics, we design reporting that answers your most important questions.
Great reporting requires more than visualization skills—it demands understanding of your business, your questions, and your data. We work closely with stakeholders to identify key metrics, design meaningful visualizations, and build sustainable reporting systems.
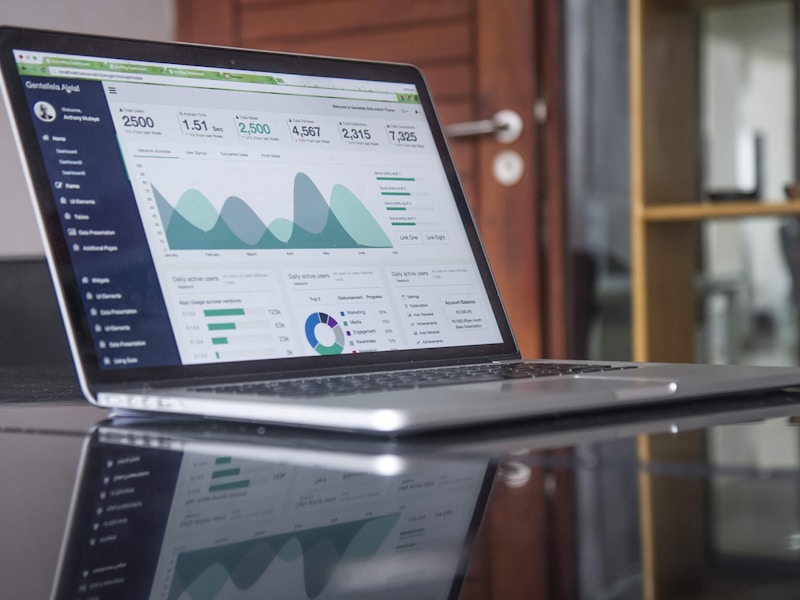
Whether you need Google Looker Studio dashboards, Power BI reports, or custom analytics solutions, we deliver reporting that's both beautiful and functional—updated automatically so you always have current insights.
Key Highlights
Custom dashboards tailored to your KPIs and questions
Automated data pipelines that keep reports current
Cross-platform data integration for unified views
Interactive visualizations for exploration and discovery
Scheduled report delivery to stakeholders
Self-service capabilities for ad-hoc analysis
Dashboard Design & Development
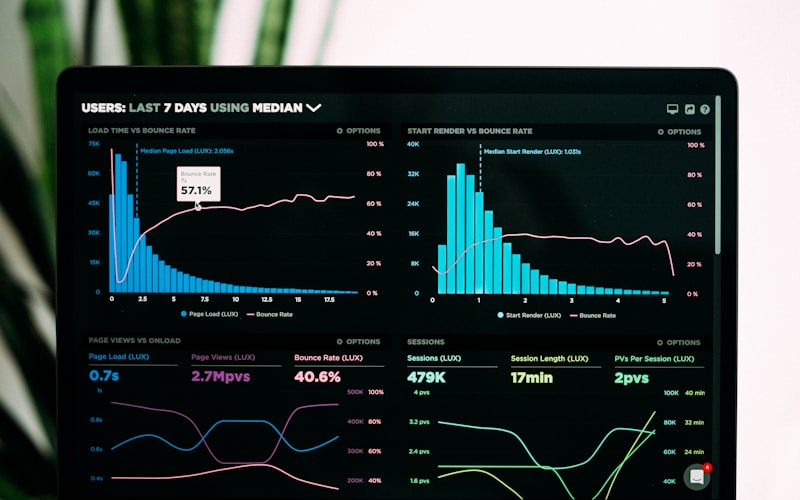
We create dashboards that answer your business questions at a glance. Whether you need executive scorecards, marketing performance views, or operational monitoring, our dashboards combine clarity with depth.

Data Integration & Automation
Reporting is only as good as the data feeding it. We build data pipelines that automatically gather, clean, and combine data from your various systems, ensuring your reports are always current and accurate.
Multi-source data integration
Automated data refresh pipelines
Data cleaning and transformation
API connections to SaaS tools
Database query optimization
Historical data preservation
Spreadsheet Automation
Sometimes Excel or Google Sheets is the right tool. We automate spreadsheet workflows with formulas, scripts, and integrations that eliminate manual work while maintaining the flexibility spreadsheets provide.

Complex formula development
Google Apps Script automation
VBA macro development
Template standardization
Data validation rules
Automated report generation
How We Work
A streamlined approach designed to deliver exceptional results
Discovery
We understand your questions, identify key metrics, and audit your current data sources and quality.
Design
We design report structures and visualizations that clearly answer your business questions.
Build
We implement dashboards, set up data connections, and configure automated refresh schedules.
Train & Refine
We train your team and iterate based on feedback to ensure reports deliver ongoing value.
Results That Matter
Reduction in manual reporting time
Dashboards deployed
Data refresh for critical metrics
Data sources integrated
Tools & Technologies
Frequently Asked Questions
Find answers to common questions about our data & reporting services.
Still have questions? Contact usWhich reporting tool should I use?
Google Looker Studio is excellent for web/marketing data with its free tier and Google integration. Power BI suits Microsoft-centric organizations with complex data. Zoho Analytics works well within the Zoho ecosystem. We recommend based on your existing tools, data sources, and requirements.
Can you connect to our existing systems?
We connect to virtually any data source—databases, APIs, spreadsheets, SaaS platforms. Common integrations include Google Analytics, HubSpot, Salesforce, Shopify, social platforms, and accounting systems. Custom API connections are also possible for proprietary systems.
How often can reports update automatically?
Update frequency depends on your data sources and platform. Many dashboards can update in real-time or every 15 minutes. Others refresh hourly or daily. We design refresh schedules based on how current your data needs to be and any platform limitations.
Can you help us understand what to measure?
Absolutely. Many clients know they need better reporting but aren't sure what metrics matter most. We help identify KPIs aligned with your business objectives, design meaningful metrics, and create reporting that drives action rather than just displaying numbers.
Ready to Build SomethingExtraordinary?
Transform your ideas into reality with a dedicated partner who understands your vision and delivers exceptional results.
- Custom solutions tailored to your needs
- Transparent pricing, no hidden fees
- Ongoing support & maintenance
- 100% satisfaction guarantee
Lightning Fast Response
Get a detailed proposal within 24-48 hours of your inquiry